
Shuffle Feature
Competitive Analysis
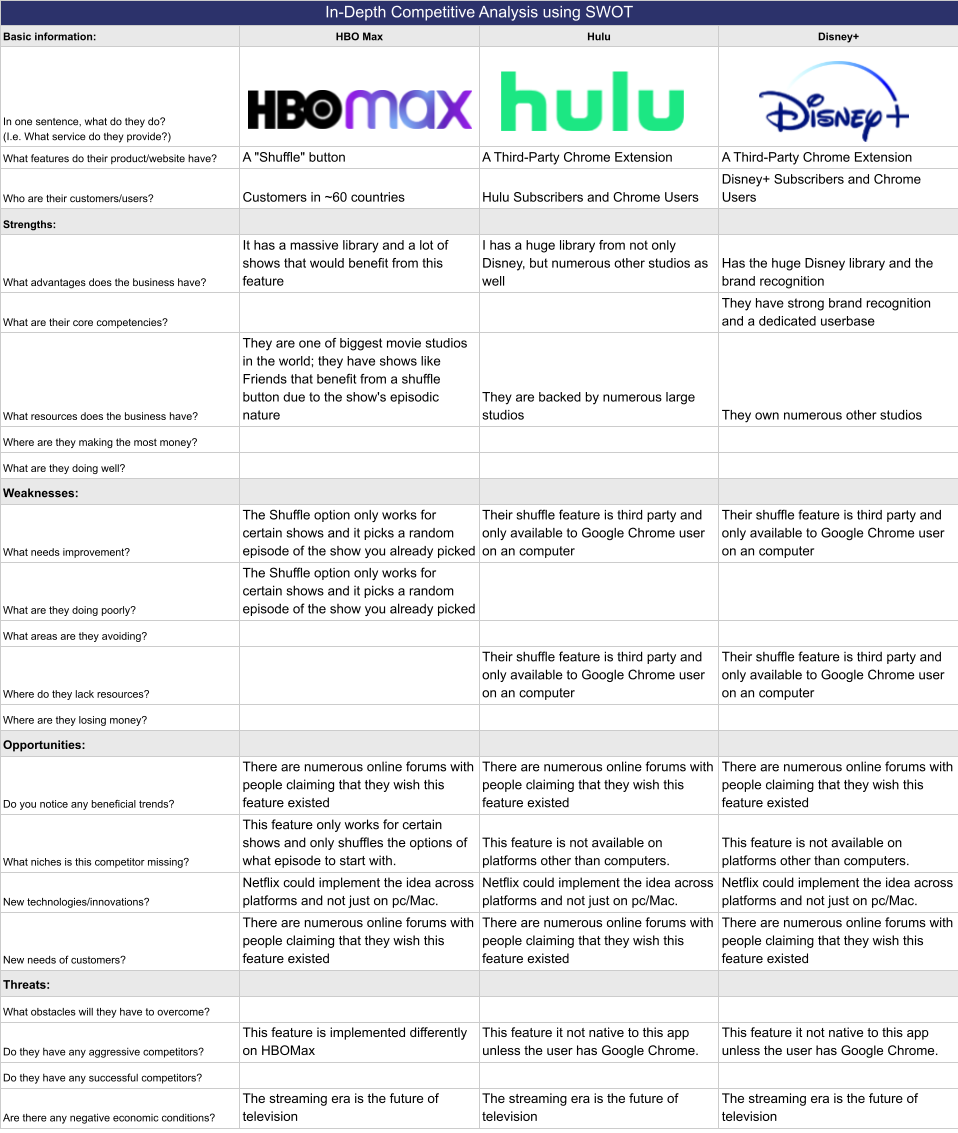
These are three other streaming services that are popular in the United States. Analyzing these allows us to learn from the successes and mistakes of other sites and brainstorm ways to improve upon existing ideas.
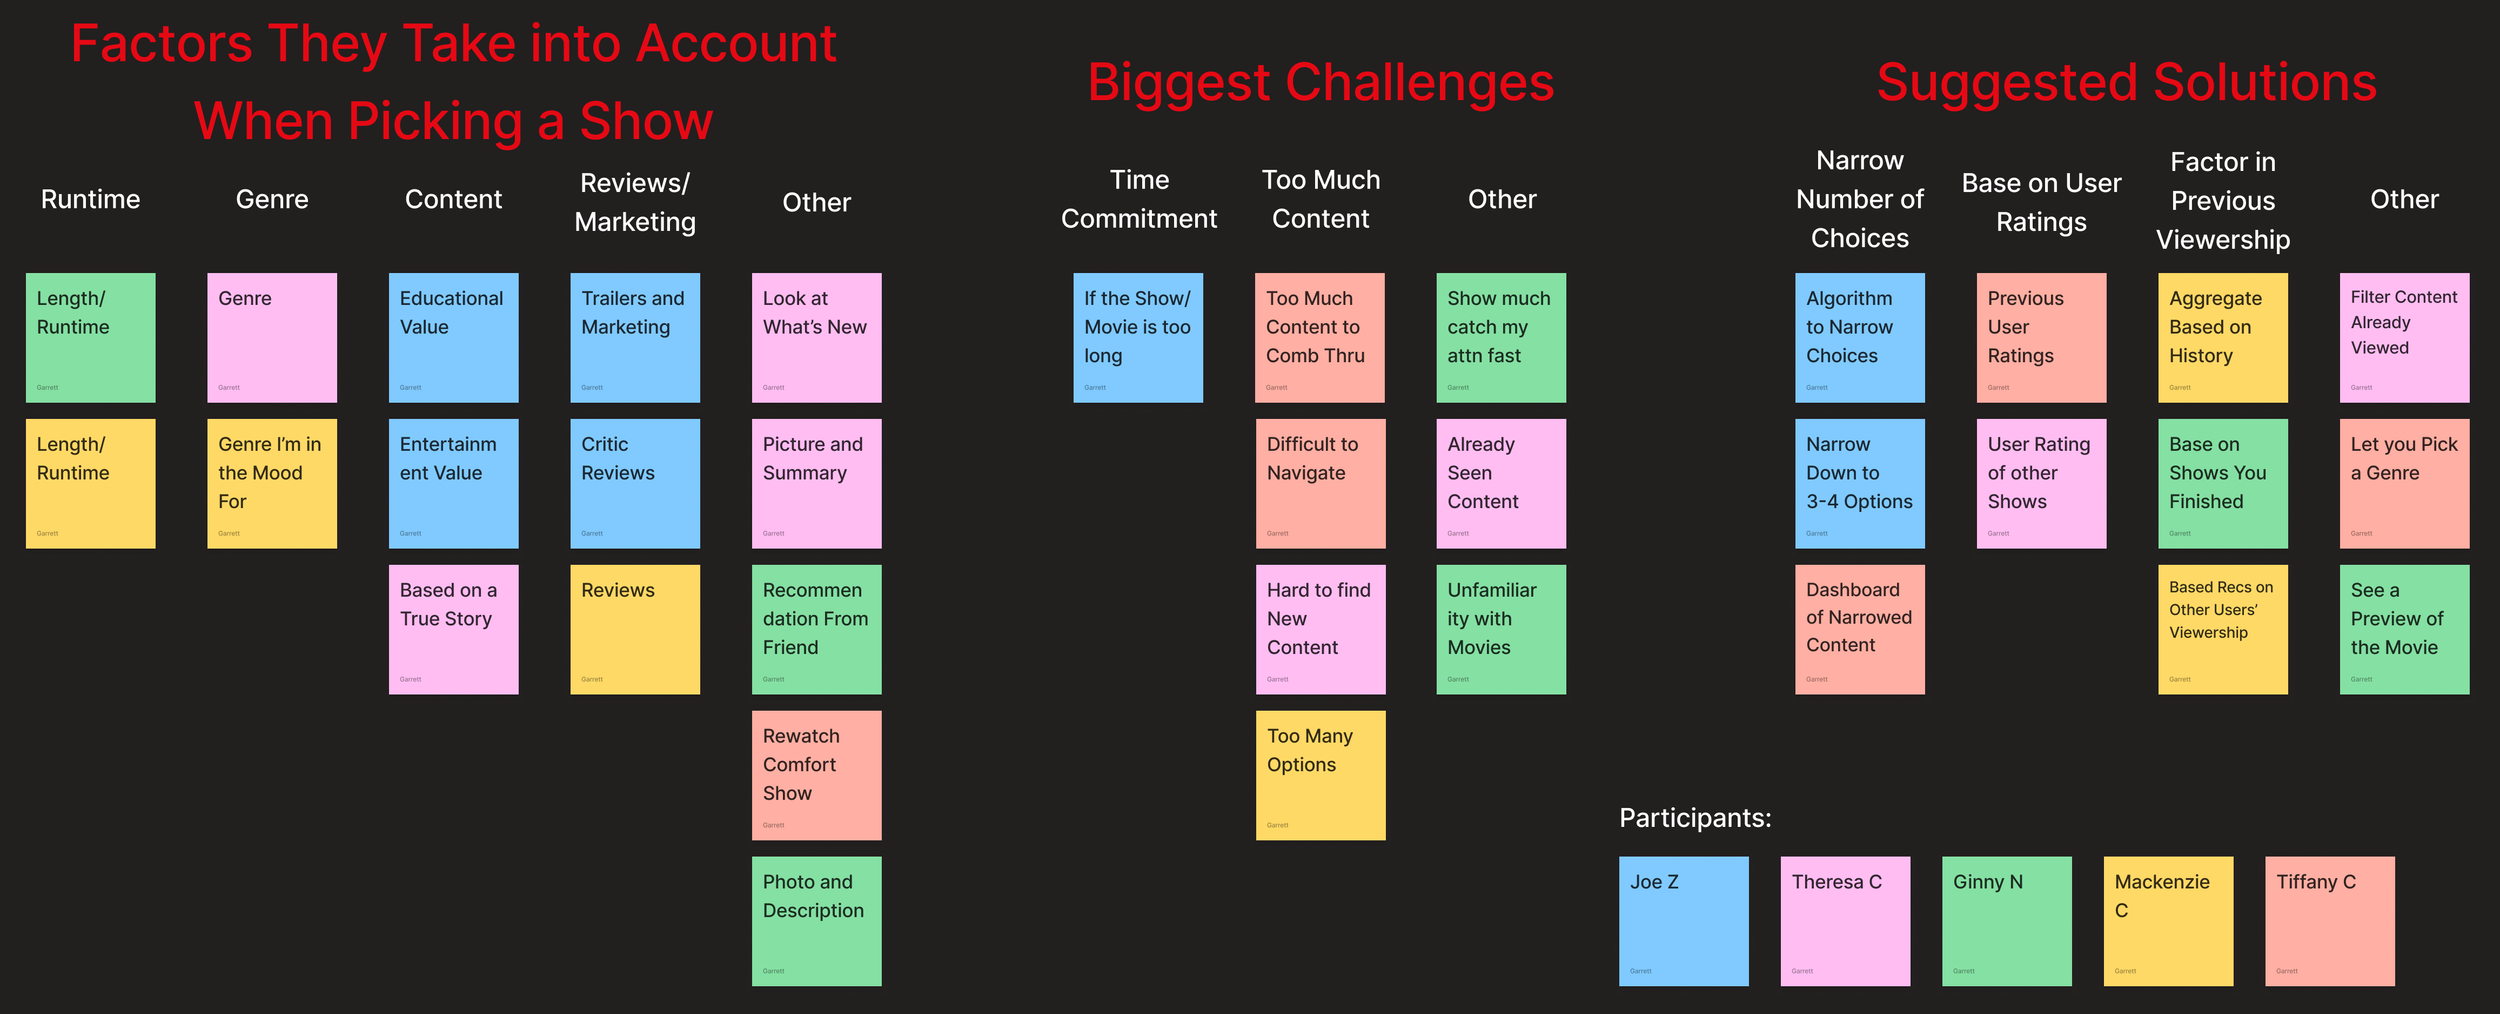
Visualize and Organize the Data
This allows the data from the interviews to be organized and categorized visually

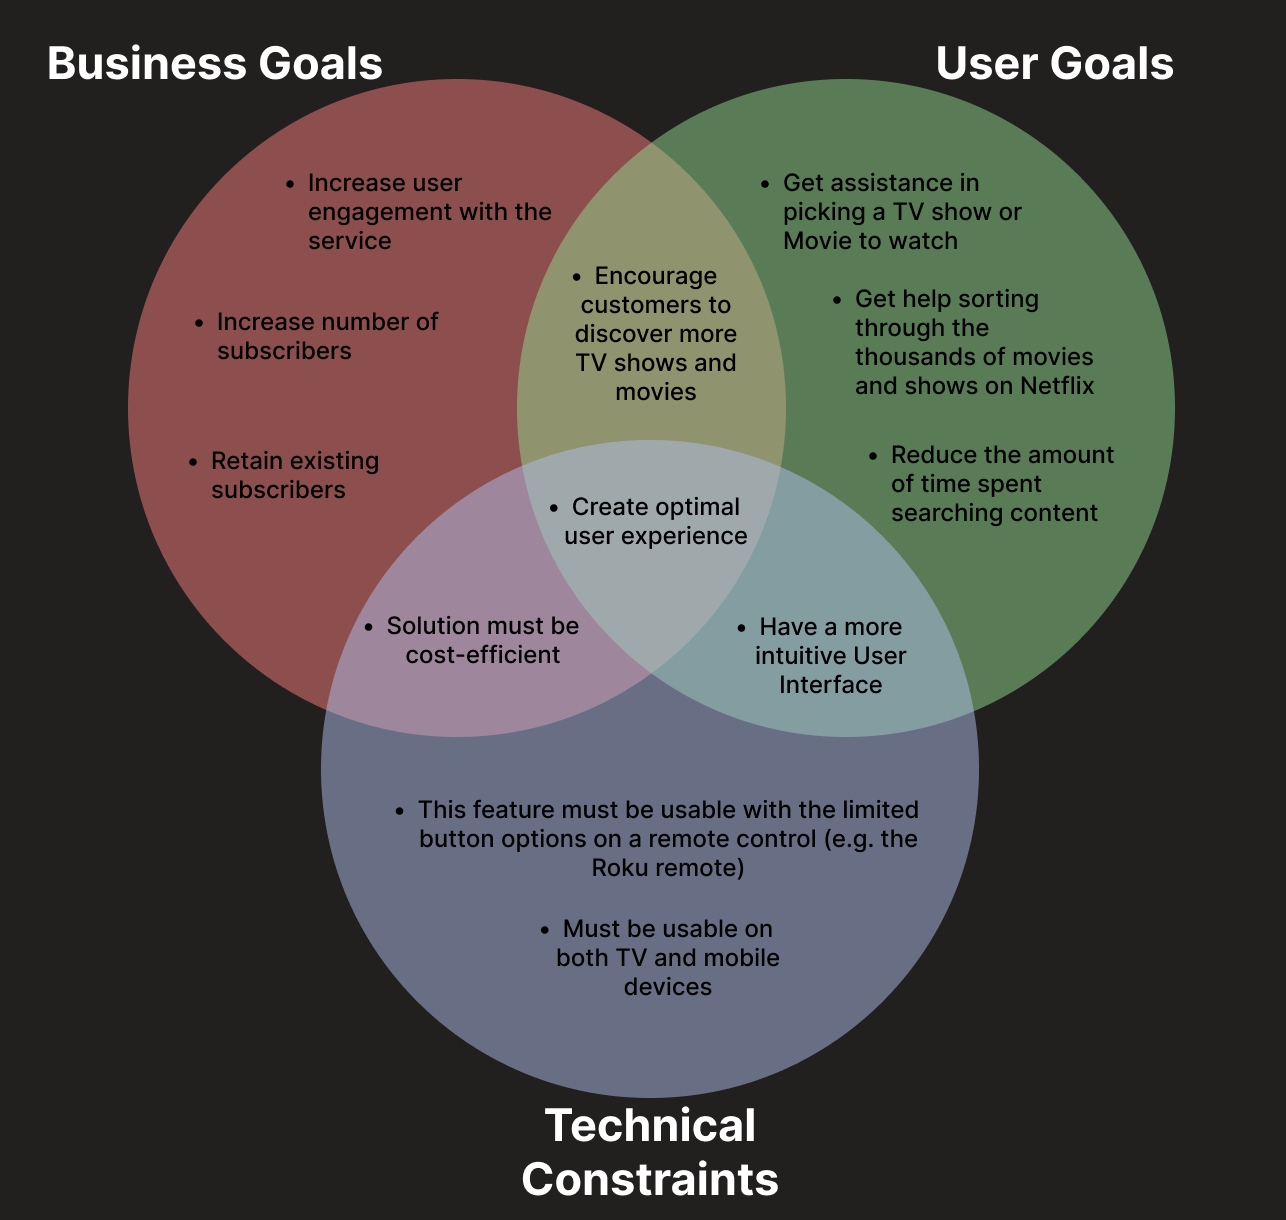
Project Goals
A Venn diagram visually conveys the goals of both the business and the users
Who is this app for?
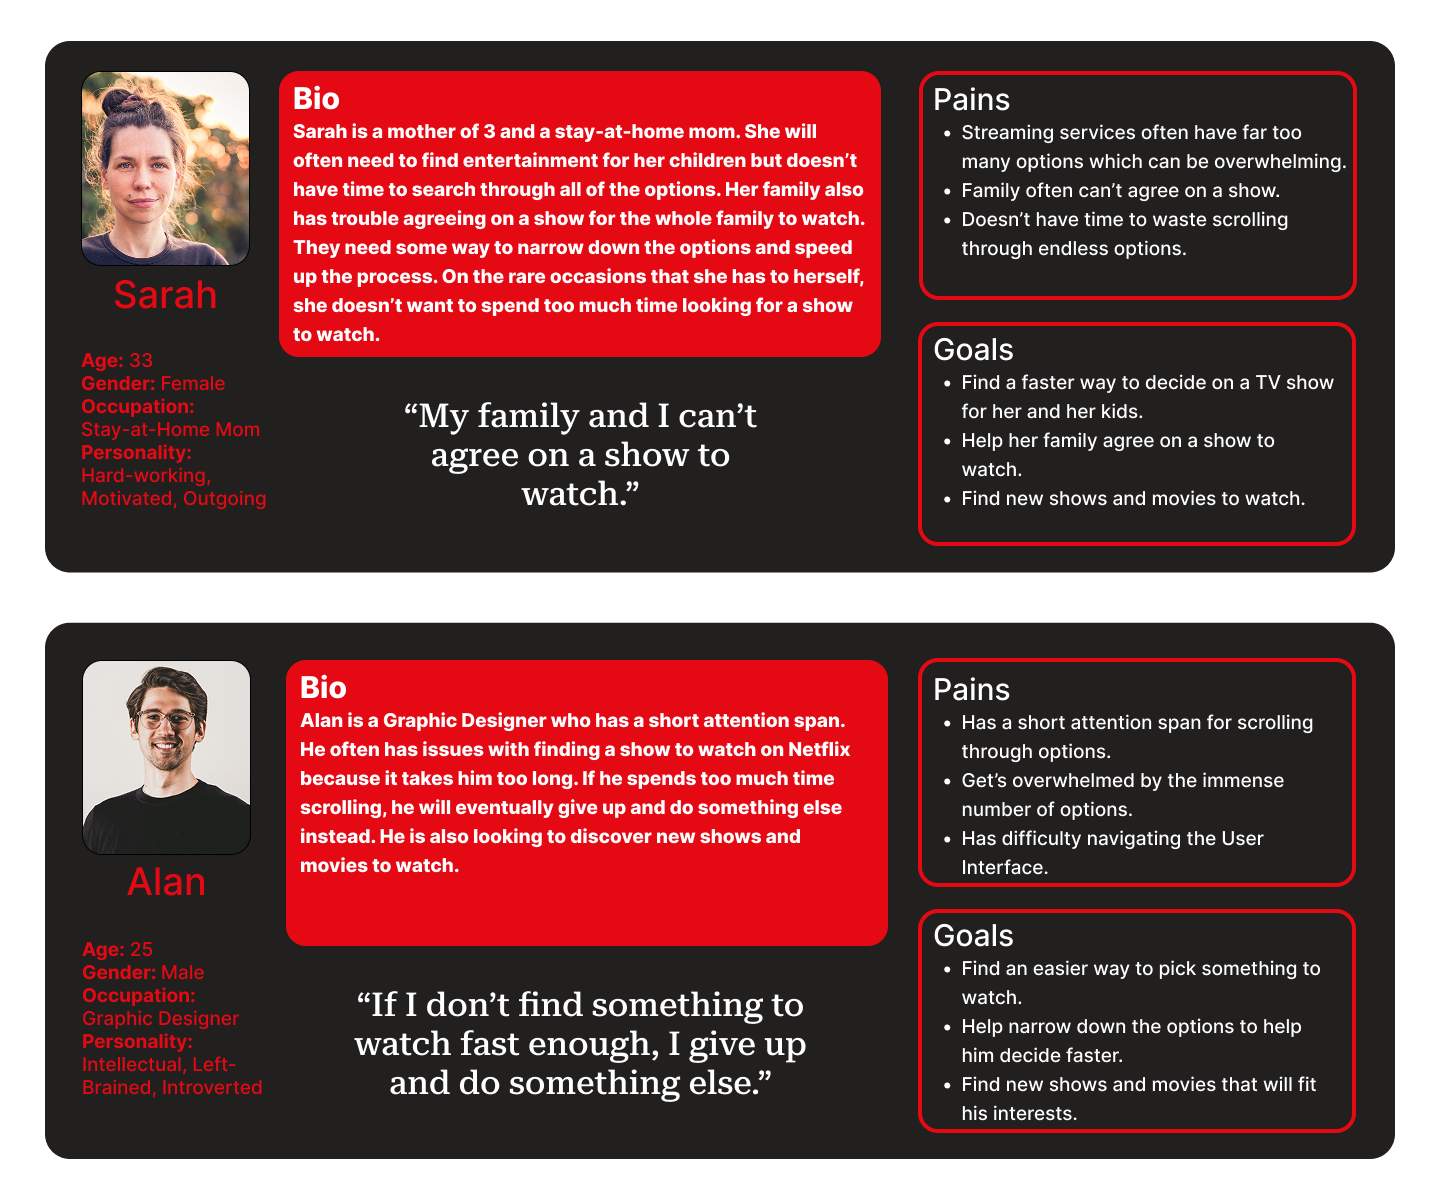
Creating user personas helps to define the target demographic of the feature
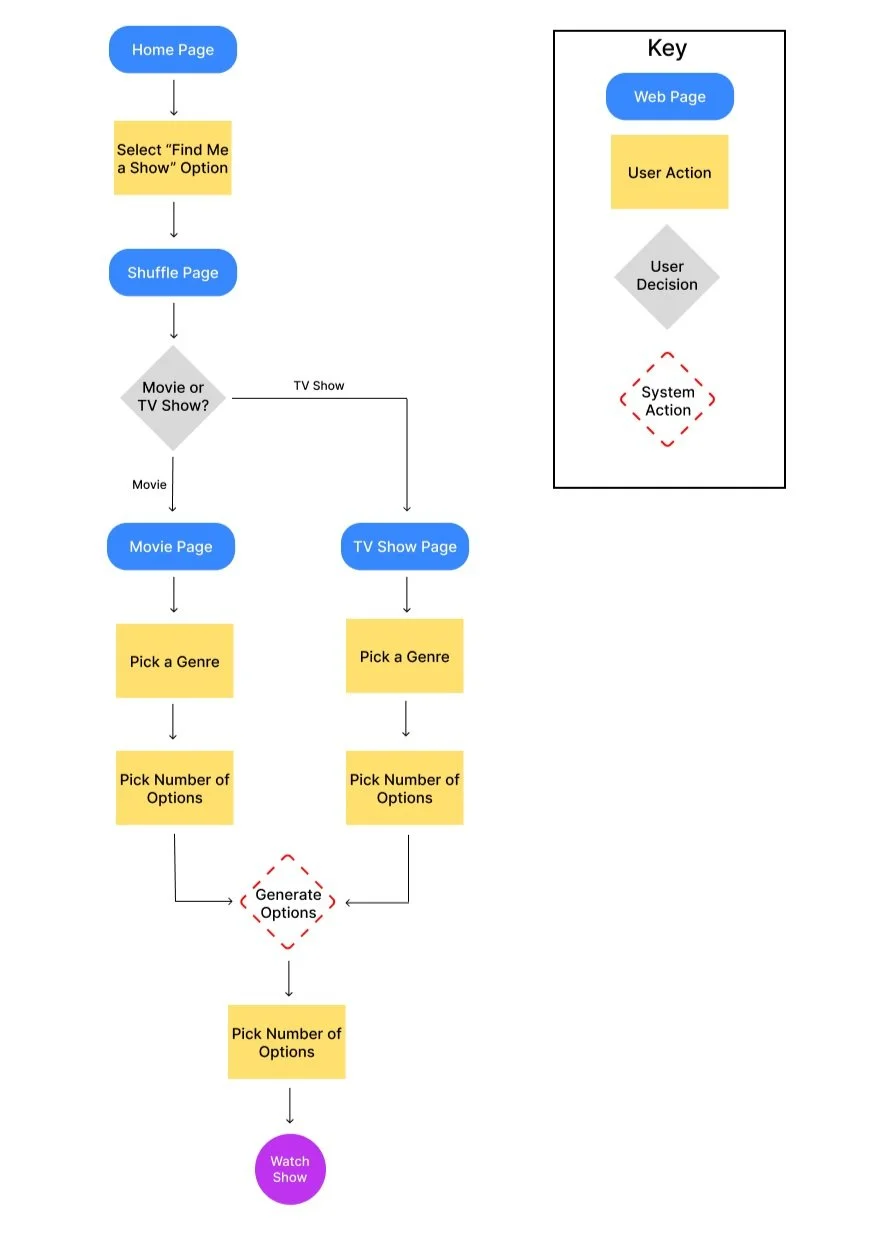
User Flows
This displays the actions and paths that the user will take when navigating the site
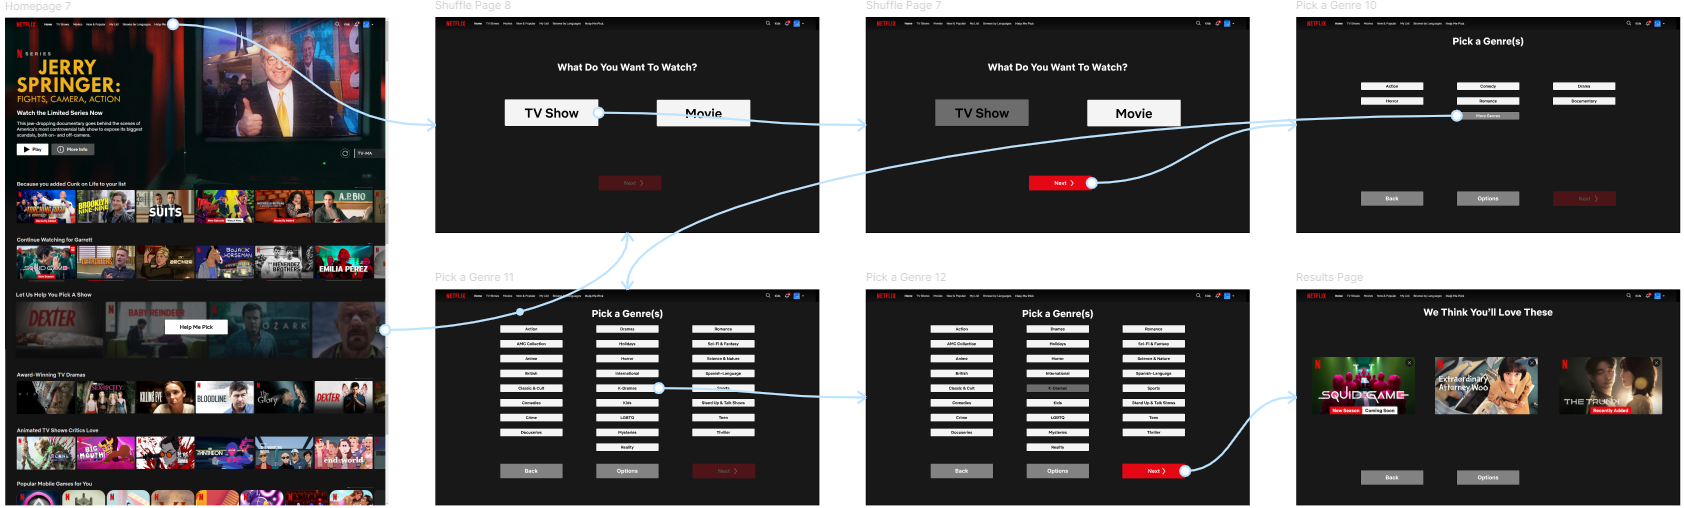
Low Fidelity Wireframes
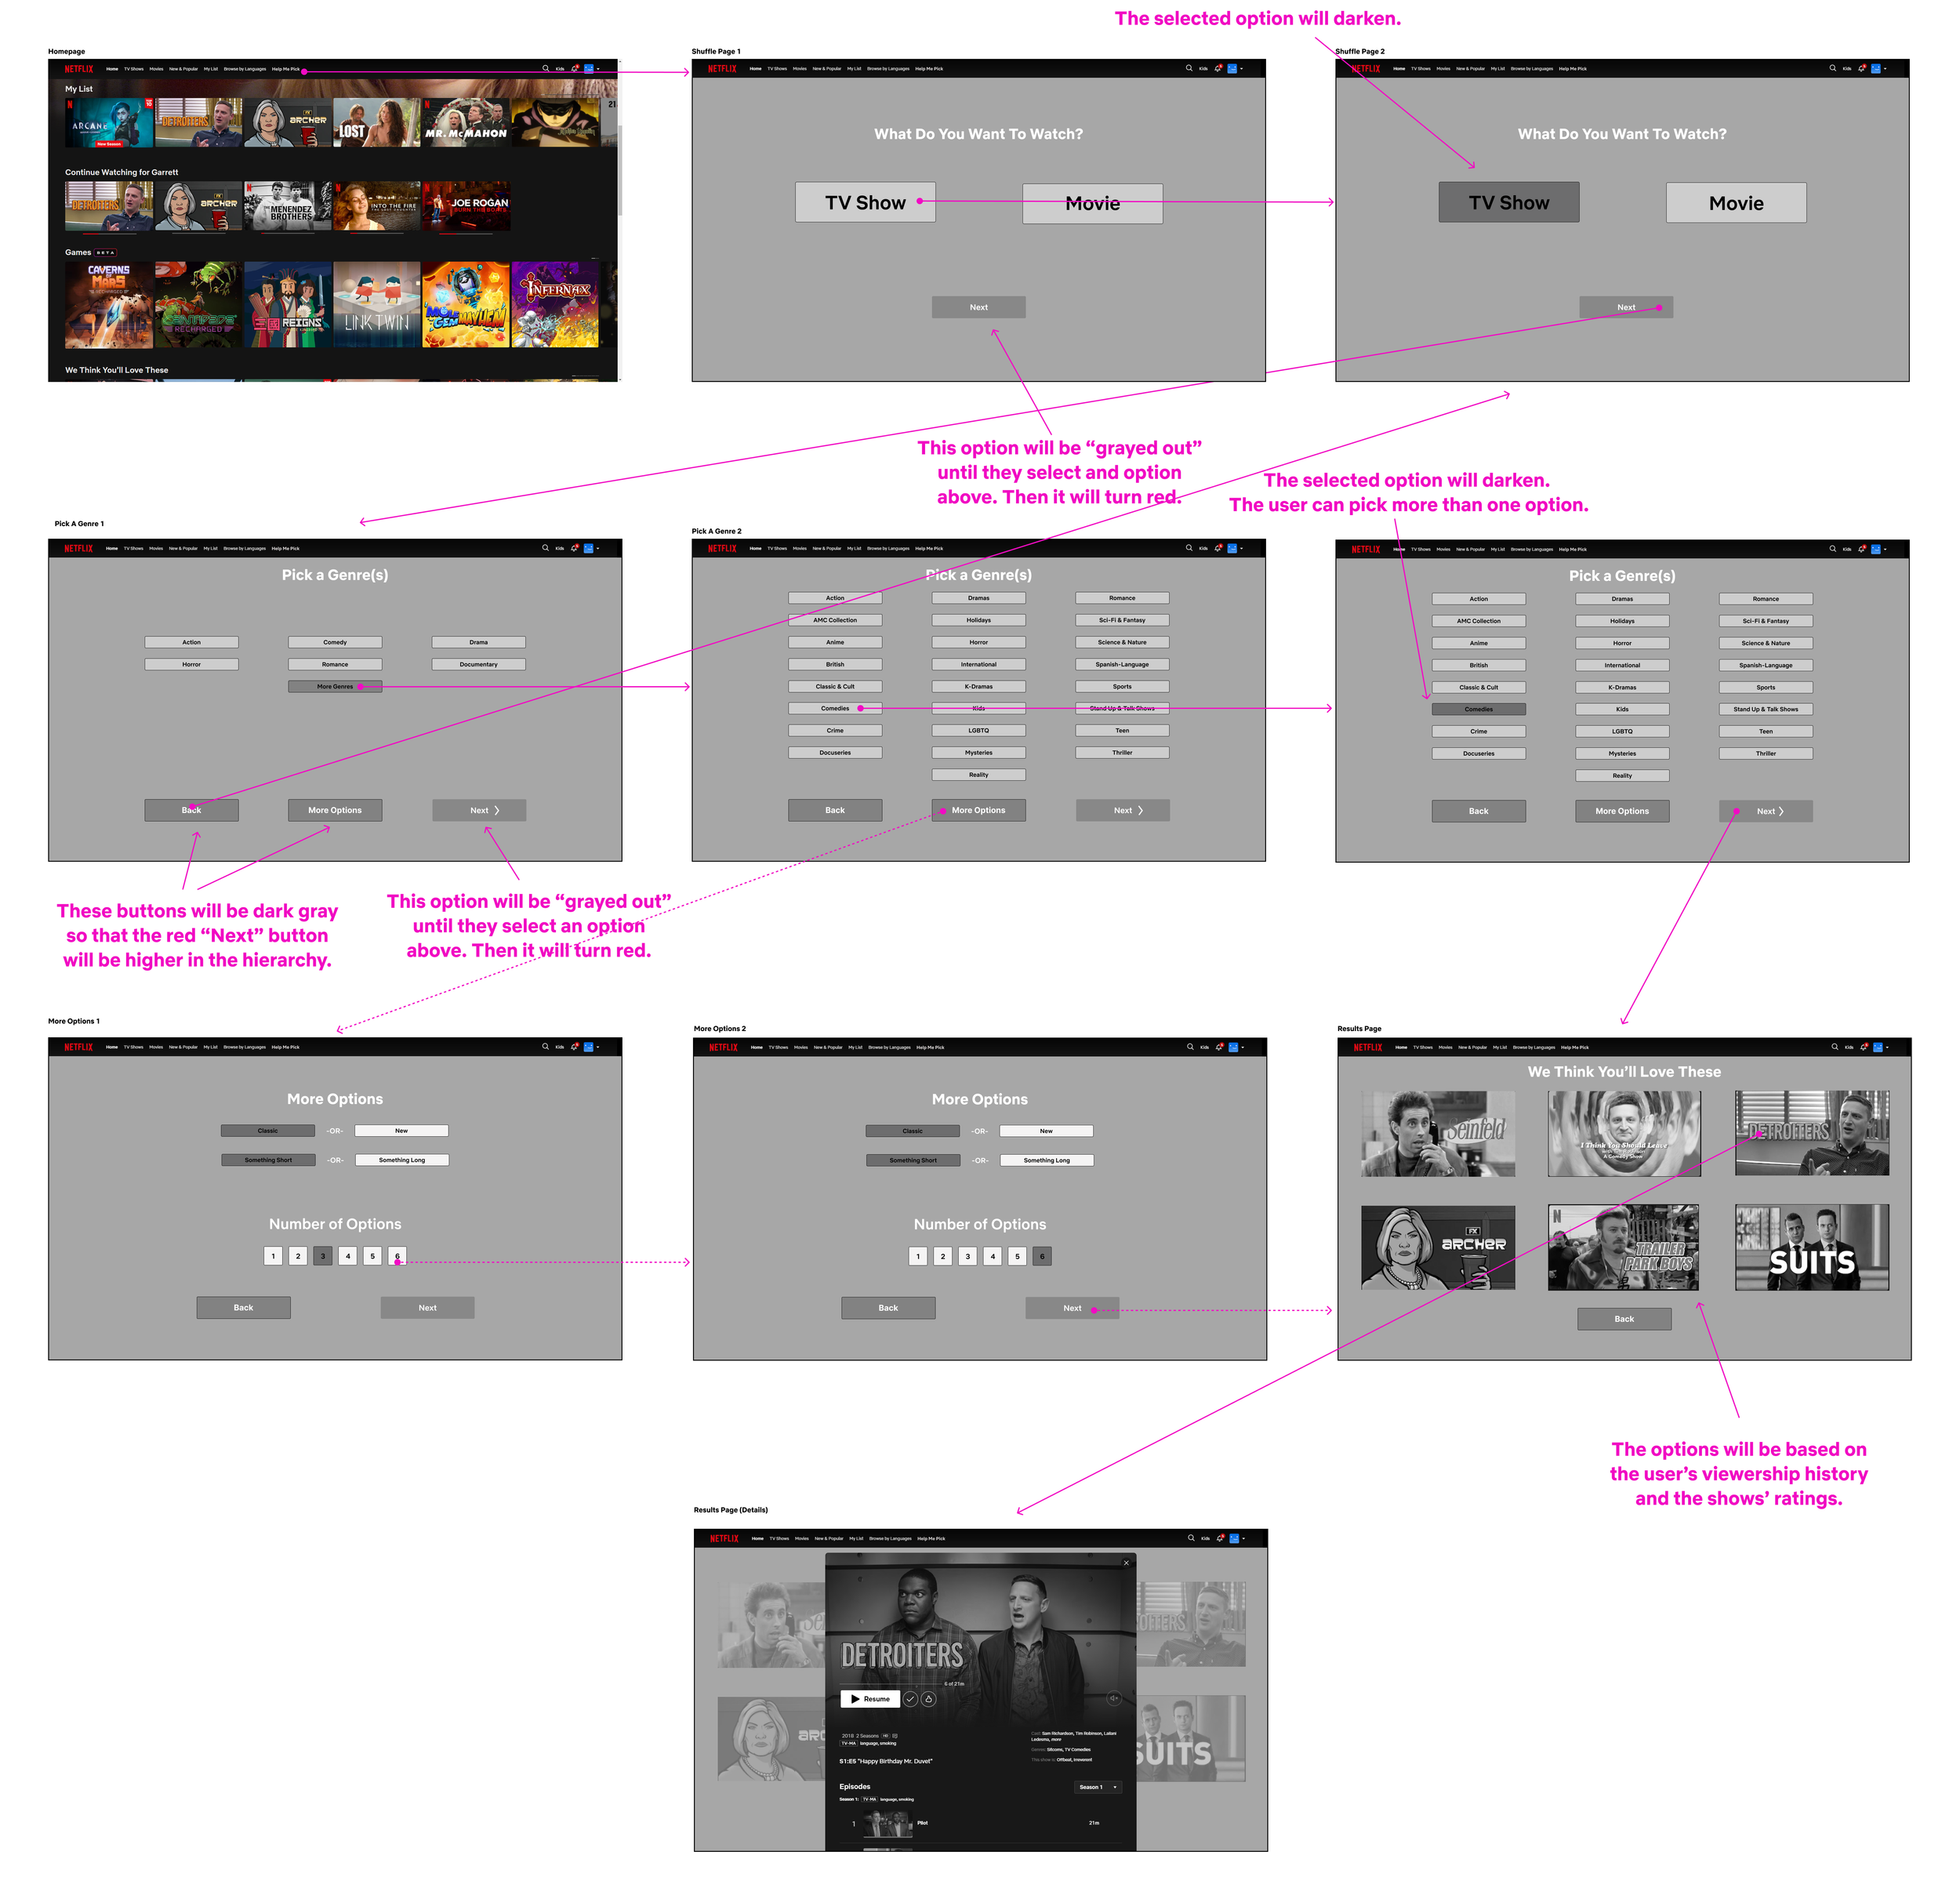
Lo-Fi mockups of each of the key pages of the site allow for a visual representation of the site’s layout and can be used for usability testing
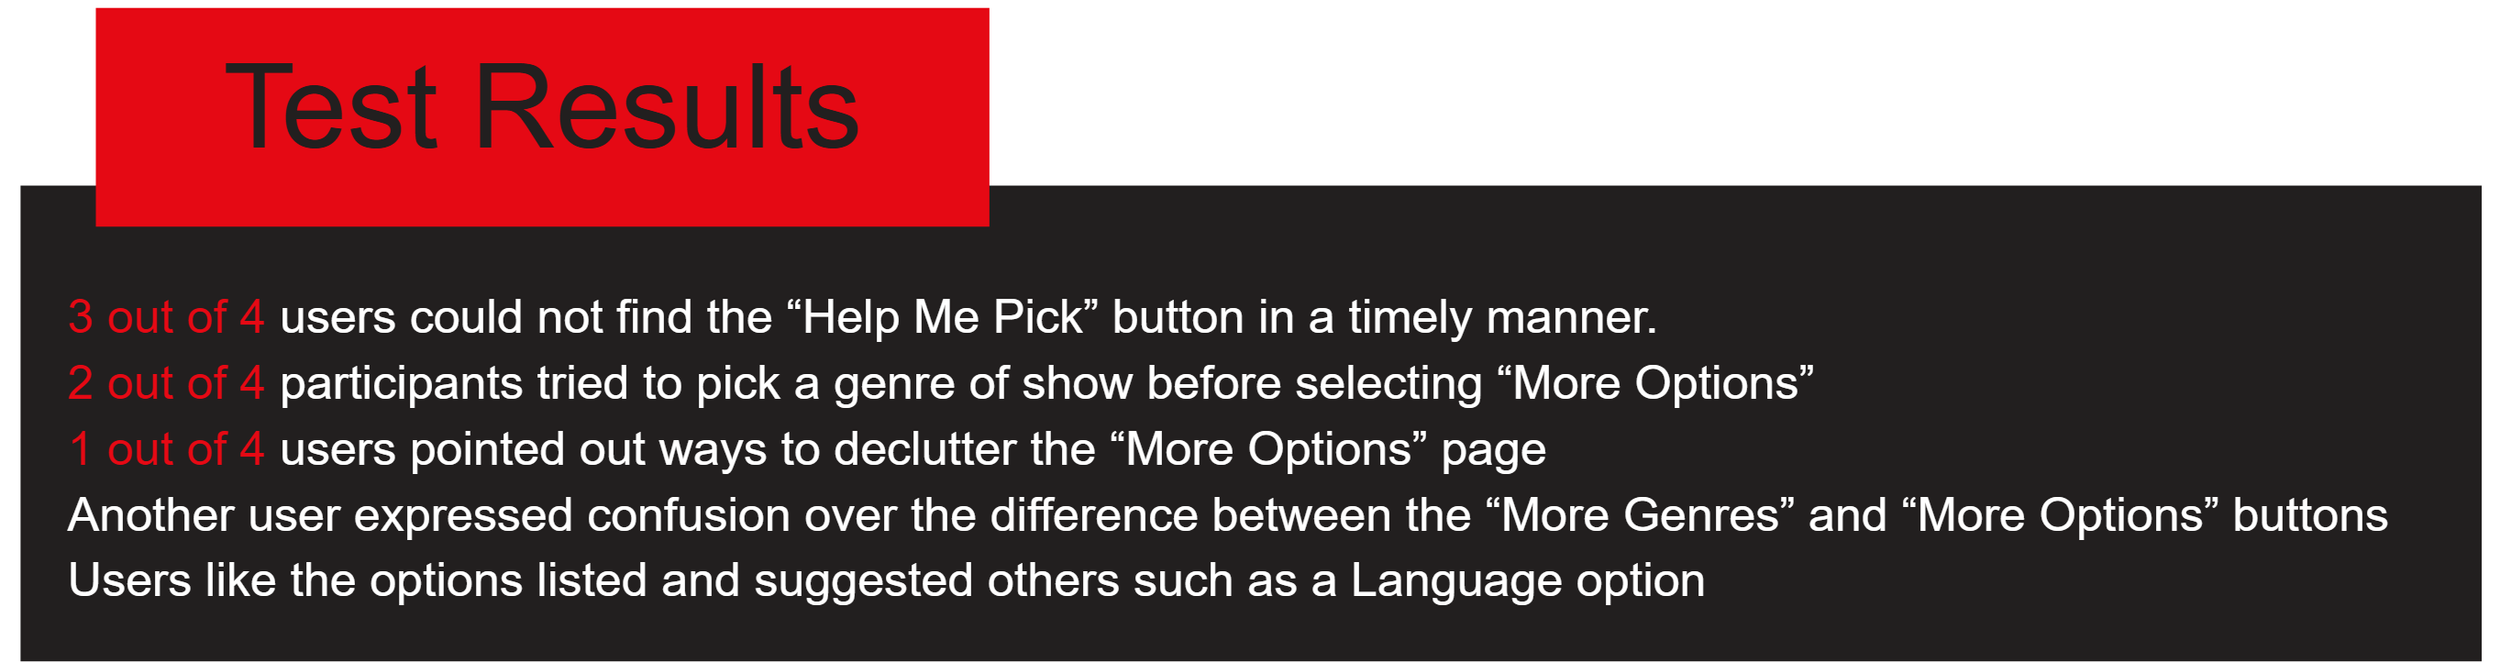
Testing My Ideas
The Lo-Fi Mockups can be used to observe how users navigate the new feature and identify any issues with the design and layout of the site
Age: 32-42 Gender: 25% Male 75% Female
Testing conducted remotely via Google Meet
Test participants were asked to perform the following 3 tasks:
User chooses a comedy show to watch.
User chooses to display 6 different comedy show options.
User searches for a K-Drama to watch.
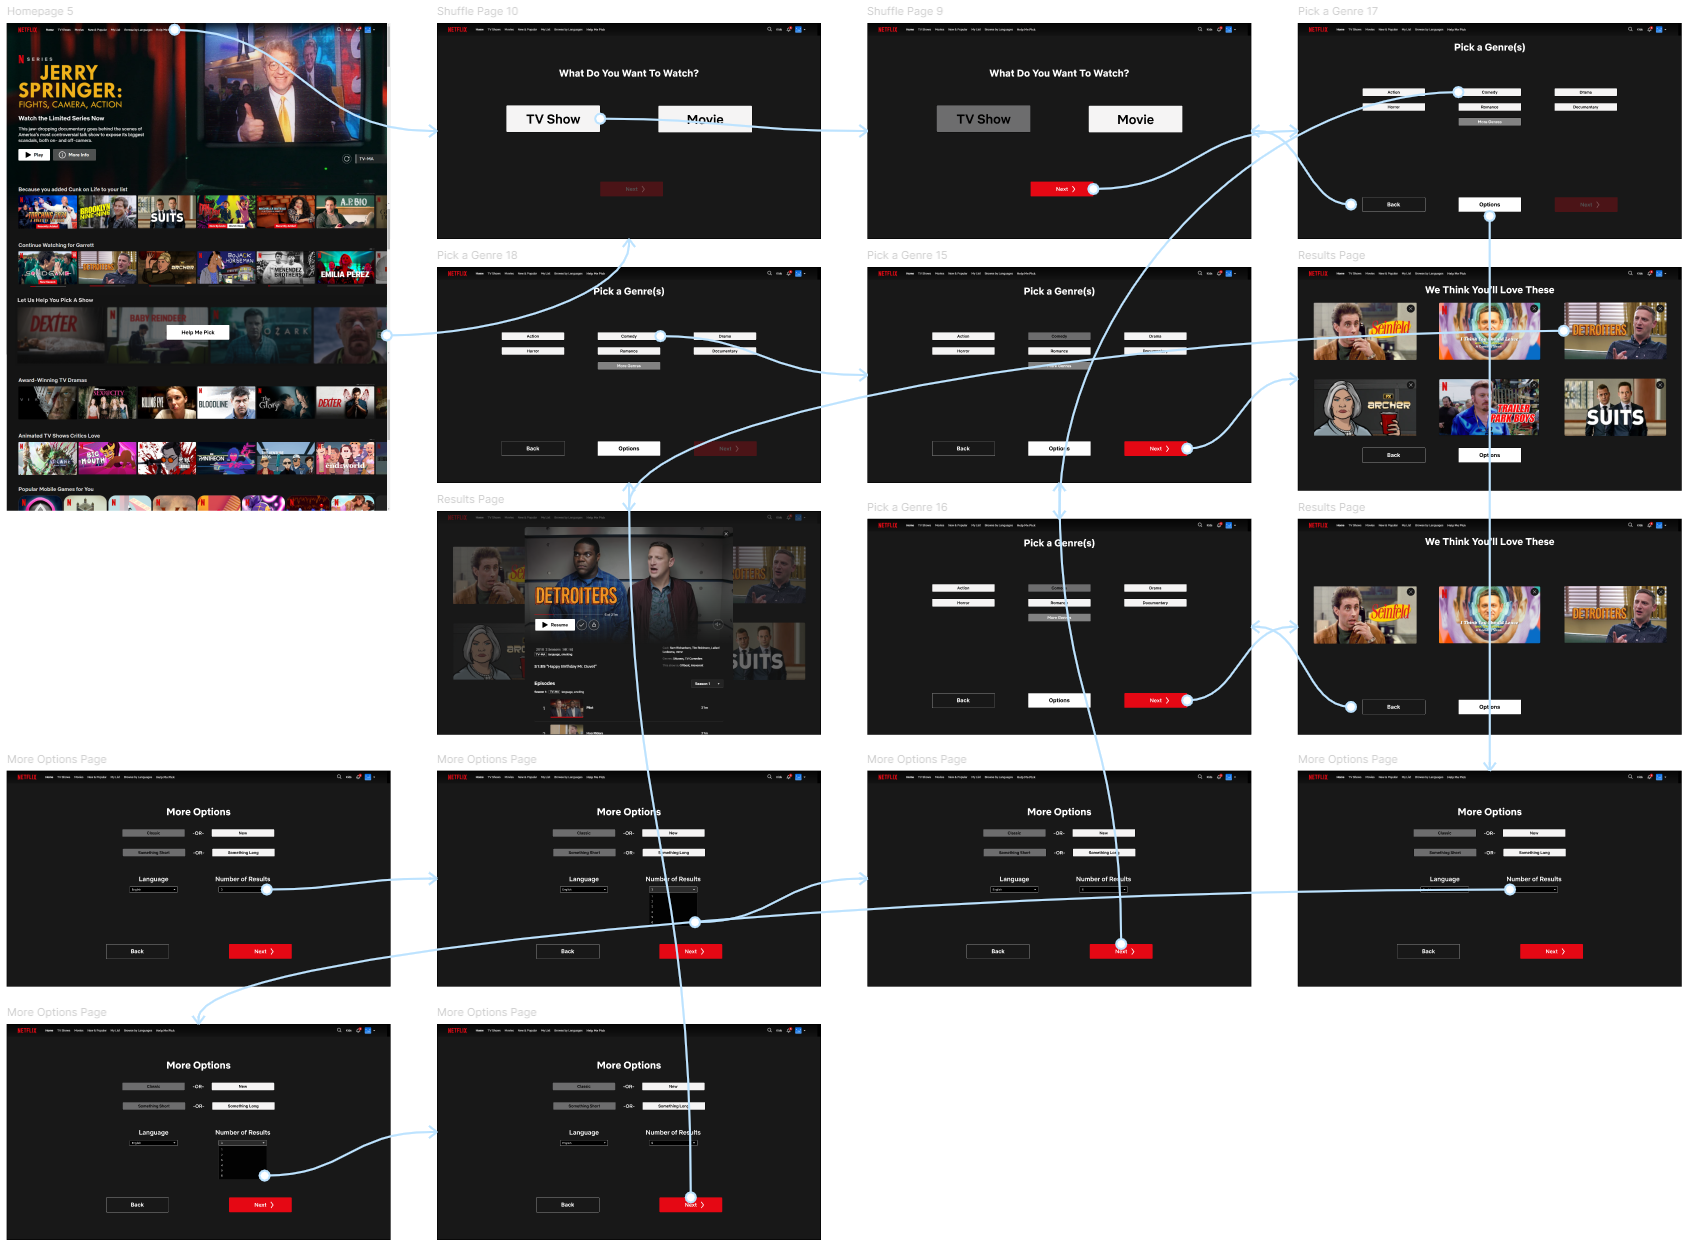
Iterate on the Design
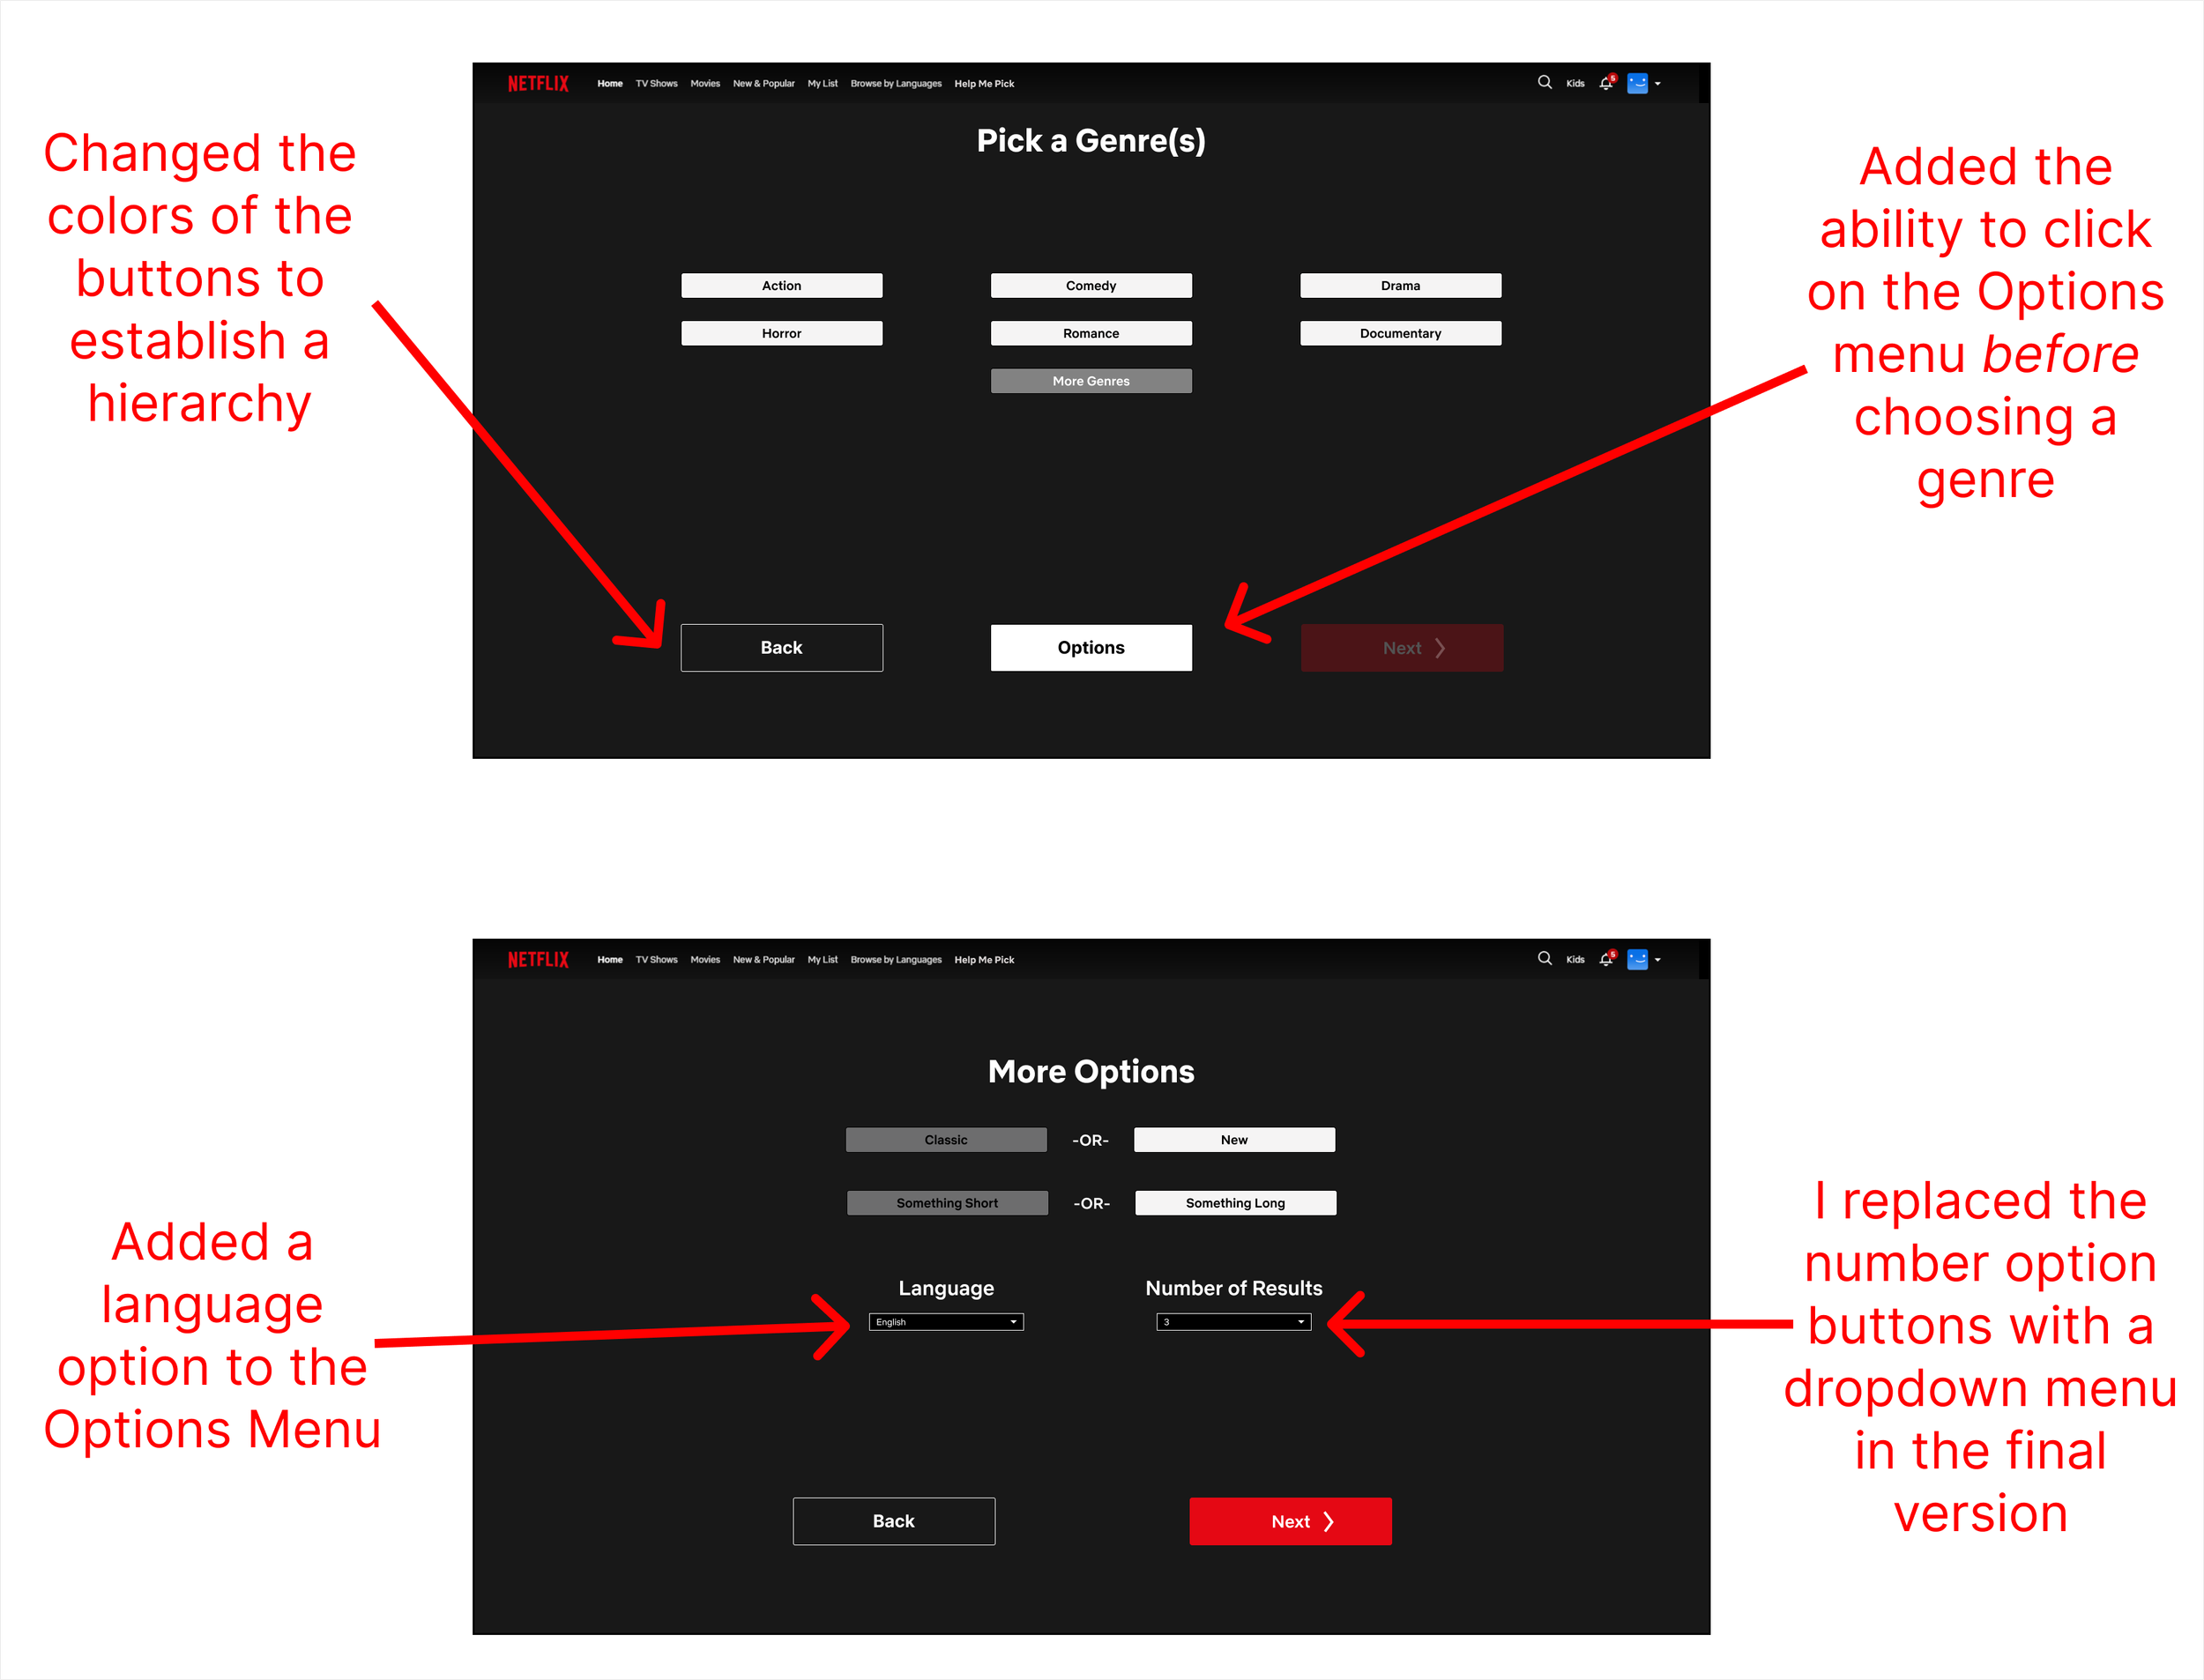
Now the pages and features have to be updated and redesigned based on the results of the usability tests
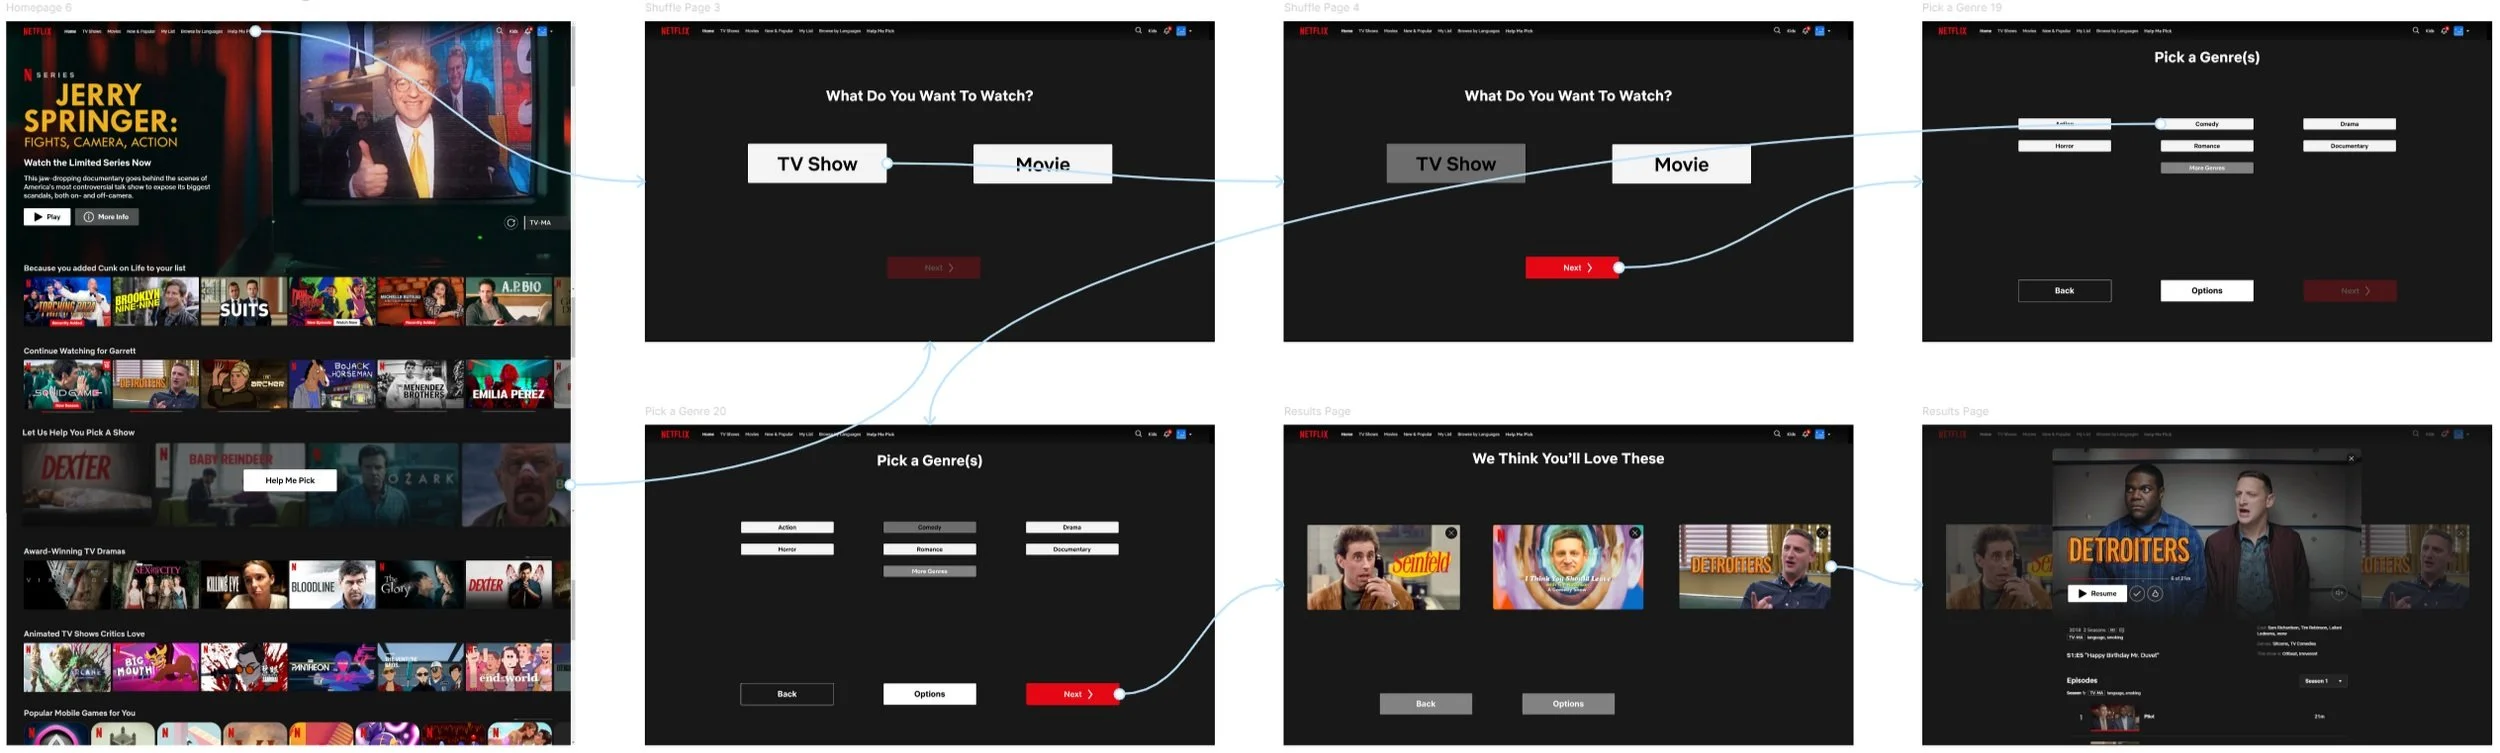
Final Prototype
This is a fully interactive version of the new feature as it would appear on the website.
Final Design
After numerous tests and iterations, the design of the new website feature is finalized!
Choose a Comedy TV Show
Choose Between 6 Comedy TV Shows